Energy-efficiency gap between high and low-income households: How bad is it? And why??

Higher-income households spend more money on energy than lower-income households because they can afford more energy-efficient appliances and homes. But because energy prices are increasing faster than income, lower-income households are affected much more by the increasing costs of energy.
Why is there an energy-efficiency gap?
A lot of research has been done into why lower-income households end up spending proportionally more on energy.
One of the most common explanations for this disparity is that wealthier people can afford more energy-efficient homes and appliances. But poorer people and minorities typically end up with the cheaper appliances, which costs them over the long run, while better appliances would save them money on their monthly energy bill.
Wealthier people purchase more energy-efficient appliances because they have the money to buy them right then. Lower-income households tend to buy these cheaper, less energy-efficient appliances primarily because they lack the ability to spend more now to save later. But there may be a small portion of this that is lack of information or lack of foresight (Gerarden).
Another explanation for this energy-efficiency disparity is that low-income households are also more likely to be renting their home (The Atlantic). Renters can’t upgrade their energy appliances, and typically pay a utility bill to their landlord. And landlords don’t necessarily feel the need to upgrade a system that will only save their renters’ money.
It’s likely that these factors all work together against low-income households to increase their energy burden.
How bad is the energy-efficiency gap?
The lowest 25% of households in the US income bracket earn between $0 and $22,500 annually (US Census). According to the US Energy Information Administration (EIA), low-income households spend $1,690 on average annually on energy bills. So for 25% of households in California, more than 7.5% of their total income goes towards energy. And for the lowest 10% of households in the income bracket, who earn between $0 and $10,500 annually, energy makes up more than 16% of their total income. This percentage of total income is known as an energy burden.
But for higher-income households–or households earning more than $48,000 annually–the story is much different. Their energy burden is significantly lower. A household earning more than $48,000 a year spends an average of $2,314 annually on energy (EIA), or only 5% of their total income.
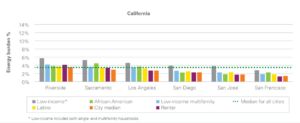
This chart shows the energy burden % disparities between different demographics within cities in California. It’s clear that low-income households consistently have a larger energy burden than average.
However, income isn’t the only thing making a difference in energy expenditures, as we can see in the chart above. Race has also been proven to make a difference. The 2018 US Census reported that the mean household income for a white family in the United States was $70,642. For a black family, it’s $41,361. So it makes sense that black households should spend a comparatively larger percentage of their income on energy.
But Eva Lyubich, a doctoral candidate in economics at UC Berkeley, reported in a study that even controlling for household size, income, and location, white households still spent $200-$300 less annually on energy than black households. This insinuates that black households are charged more, for whatever reason, for their energy expenditures.
Maximilian Auffhammer, an environmental economics professor at UC Berkeley, summarized Lyubich’s findings, saying that “so long as this energy cost inequity persists, any future carbon/energy tax, or other policy that raises energy costs, is likely to increase energy expenditures more for Black households–especially poor ones–than for white households in the same income bin. And that’s just wrong.” And Latino households experience a similar discrimination (Assets).
Not only do lower-income and minority households spend more comparatively on energy, but the increasing cost of energy disproportionately impacts them, because energy prices increase faster than their income. “From 2004 to 2014, average US residential electricity prices increased from 9 cents/kWh to 12.5 cents/kWh, an increase of 39% (EIA 2016a). In contrast, average adjusted income grew from $29,900 in 2004 to $30,180 in 2014, an increase of 0.9% (Census Bureau 2014). If energy prices continue to increase more rapidly than income, energy burden will continue to grow for vulnerable households” (Assets).
So while currently, 7.5% of a low-income household’s income goes towards energy, if prices and incomes continue to increase at the same rate, in ten years, the 7.5% could become 11%.
The state of California requires energy providers to increase the cost of energy as motivation for people to upgrade to renewable energy sources, but in some ways, this doesn’t make sense. Where the higher-income households can afford the increase in energy costs, and often can even afford the renewable energy upgrades, the lower-income households can afford neither.
So if your energy bill seems higher or lower than California’s average and you can’t figure out why, it might have to do with your income bracket, or even your ethnicity.
Side note: this gap is actually comparatively quite small in California, so good going.
References:
Primary sources:
https://assets.ctfassets.net/ntcn17ss1ow9/1UEmqh5l59cFaHMqVwHqMy/1ee1833cbf370839dbbdf6989ef8b8b4/Lifting_the_High_Energy_Burden_0.pdf
https://haas.berkeley.edu/wp-content/uploads/WP306.pdf
Consuming Energy While Black
https://www.census.gov/content/dam/Census/library/visualizations/2019/demo/p60-266/figure2.pdf
https://pubs.aeaweb.org/doi/pdf/10.1257/jel.20161360
- One set of possible explanations for the energy-efficiency gap is related to… the variety of energy-efficient products on the market, their energy-efficiency levels, and their pricing. (Not an area of high priority)
Social energy-efficiency gap: consumers who hold biased beliefs about energy prices or their expected energy use will make decisions that do not appear optimal, given observed prices. - So the more educated will be able to make better, more-informed decisions on what appliances to purchase, what companies to give their money to
- Existing policies (for example, gasoline taxes, carbon pricing, and electricity price structures) appear not to provide sufficient incentives for energy efficiency from an economic perspective
- Underinvestment in energy-efficient technology due to downward-biased beliefs about fuel prices
Secondary sources:
https://www.axios.com/persistent-racial-disparities-energy-expenses-fde229f4-f8a0-4542-a594-8705e8d4dfbc.html
- Black households spend more money on energy than white households
https://www.vox.com/energy-and-environment/2020/3/20/21184814/climate-change-energy-income-inequality
- Rich people use more luxury goods (e.g. travel) so use more energy
- As people get wealthier, they spend more on transport (cars, boats, planes, vacations), which is one of the most energy-intensive consumer categories.
- Shouldn’t there be a middle class plateau where people buy more energy-efficient stuff and don’t spend that much more on travel expenses?
- The top 10% of the global income spectrum consumes 20 times as much final energy as the bottom 10%.
Most energy is expended as heat and electricity (basic but high intensity). Second most is vehicle fuel (luxury and high intensity). - Since most energy is expended as heat and electricity–and as the article points out, there’s only so much you can spend on heat and electricity, even with a huge house–maybe the difference isn’t as great as they make it out to be?
- As income inequality rises, energy footprint inequality rises even faster.
https://www.theatlantic.com/business/archive/2016/04/why-poor-americans-have-some-of-the-highest-electricity-bills/478551/
- The lowest segment of earners pays considerably more of their income for electricity (9.92% of their income, while the highest twenty percent spends 1.38%).
- Families earning less than $40,000 a year use energy more intensively than wealthier families (6.45 KWH per SqFt vs. 4.79 KWH per SqFt, or $0.75/sqft vs $0.58/sqft). So while families earning more than $40,000/year spend more total, at $1533/year versus $1105/year, it’s comparatively less. (Groundswell.)
- Low-income households also face a split-incentive problem. They’re much more likely to rent compared to wealthier families, and in almost all cases, the renter pays the utility bill. That means, on one hand, renters can’t make efficiency upgrades because they don’t own the property. Landlords, on the other hand, don’t have an incentive to pay for upgrades that would only save their tenants money.
- “This level of consumption is clearly beyond what you need to provide for your survival, to allow you to be a functioning member of society,” the study’s lead author, Eric Fournier, told the Los Angeles Times. He and his fellow authors thought long and hard about their descriptions of “excessive” and even “profligate” energy consumption. Apparently, academics should decide how much electricity everyone else should use.”
It is not “an undeniably good thing that we can use more energy than we need for our basic survival.” Our planet is dying! Eek!
https://www.reimaginerpe.org/node/965
- In a recently published study, “Utility-Financed Low-Income Energy Conservation: Winning for Everyone,” one of the Energy Policy and the Poor series, the National Consumer Law Center, Inc. (NCLC) studied the relationship between energy use and failure to pay among low-income families relative to the nation as a whole. The study showed that the inability of a family to pay its energy bill is not, as many have thought, strictly the result of high energy bills, or of energy “wastage.” In fact, low-income households generally use about 20% less energy than the non-poor; this conclusion is valid for the various fuels (electricity, fuel oil, and natural gas) used for different household tasks. The study found that the higher the portion of income needed for energy bills, the higher the rate of failure to pay. Payments for this fuel, though, can equal 25% of the total income of a poor family, as opposed to around 7% for the non-poor.
- It will be difficult for the typical poor family acting alone to make further cuts in energy use. One reason for this is that low-income dwellings generally use more energy per unit area; this fact is largely a reflection of the low quality of poor people’s housing. A 1986 study by the Economic Opportunity Research Institute showed that the average poor family spends up to 94% of its income on housing, food, and home energy. Very little remains for other items which can also be considered as basic needs: health care, clothing, transportation, etc. In short, the poor are under immense economic pressures to conserve energy, and are making a large daily effort toward that end.
https://academic.oup.com/reep/article/8/1/18/1588147
https://www.washingtonpost.com/news/posteverything/wp/2018/01/25/why-it-costs-so-much-to-be-poor-in-america/
https://www.valuepenguin.com/banking/average-checking-account-balance
- The median checking account for Americans making less than $25,000 a year is $500.
https://en.wikipedia.org/wiki/Income_in_the_United_States
- Yes, the average income of a household in the United States is $59,039. But the bottom 10% of households in the United States earn between $0 and $10,500 annually. The bottom 20% earns between $0 and $18,500. The bottom 25% earns between $0 and $22,500.
https://livingwage.mit.edu/articles/61-new-living-wage-data-for-now-available-on-the-tool
- The living wage, or the wage that is high enough to maintain a normal standing of living, including adequate shelter, food, and other basic necessities, in the United States, according to MIT, is $68,808 per year, but the bottom 66% of households in the country earn less than $62,500.
- Find the average electric bill?
https://livingwage.mit.edu/states/06
https://www.businessinsider.com/how-high-income-and-low-income-americans-spend-their-money-2017-3
- Percent of annual household spending by income, and then actual monetary expenditure of annual household spending (of top 20% and bottom 20%)